.

Tag: graphs

Science things that are awesome…

(Also, all of these goofy pics are now being archived at a tumblr I just set up – scienceisawesomethatisall.tumblr.com)

votingisawesome

O.K. Yesterday was our provincial elections (in British Columbia), and in the end, the Liberal party came out winning. There’s quite a few environmental issues that are in the forefront in my neck of the woods, not the least of which concerns the Northern Gateway pipeline.

The Liberals didn’t actually have the greatest platform on this (at least from an environmental or science policy standpoint), but here’s hoping the public continues to pressure them to do the “best” (re: what scientific expert peer review suggests) thing for the province, and indeed the planet at large.

hydrasareawesome

Last Saturday, my lab opened up the entire ground floor of the Michael Smith Building to the public. This was in conjunction with Science Rendezvous, a cross Canada science festival, and in the case of UBC, organized by the Faculty of Science. In the house (so to speak) were folks from the Beaty Museum, Civil Engineering, Pathology, Physics and Astronomy, as well as the Engineering Physics Robotics lab (who also brought in their 3D printers). We also used the building as ground zero for a number of tours throughout campus.

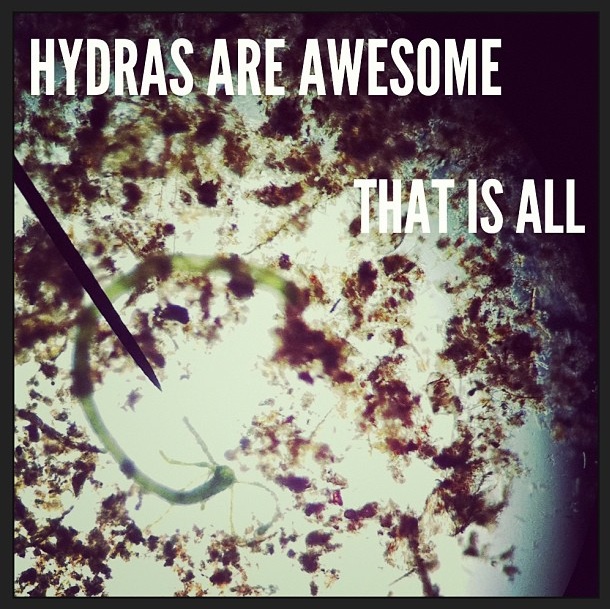
All in all, a great day (and busy too!). In my space, I actually brought out about a dozen or dissecting scopes and collected a nice jar of pond scum. Kids (and their parents), with some basic instructions, were let loose to find whatever they could find in the pond water. Lots of cooties were found, protozoa and algae abound, but my favourite was this Hydra that I managed to get a decent picture of on my iPhone.

venndiagrams

The scientific method – it’s not perfect, but it’s pretty much the best way out there on collecting your thoughts and information to make sound decisions. All the more so, if the decision is high stakes IMHO.

Tupper’s self-referential formula #whoa

Learning about this has made my brain quietly implode.

“Tupper’s self-referential formula is a self-referential formula defined by Jeff Tupper that, when graphed in two dimensions, can visually reproduce the formula itself. It is used in various math and computer science courses as an exercise in graphing formulae.

Specifically (From Wikipedia):

The formula is an inequality defined by:

{1\over 2} < \left\lfloor \mathrm{mod}\left(\left\lfloor {y \over 17} \right\rfloor 2^{-17 \lfloor x \rfloor - \mathrm{mod}(\lfloor y\rfloor, 17)},2\right)\right\rfloor

where \lfloor \cdot \rfloor 
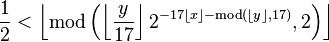
denotes the floor function and mod is the modulo operation.

Let k equal the following:

48584506361897134235820959624942020445814005879832445494830930850619347047088099284506447698655243648499972470249151191
104116057391774078569197543265718554420572104457358836818298237541396343382251994521916512843483329051311931999535024137
58765239264874613394906870130562295813219481113685339535565290850023875092856892694555974281546386510730049106723058933586
052544096664351265349363643957125565695936815184334857605266940161251266951421550539554519153785457525756590740540157929
001765967965480064427829131488548259914721248506352686630476300

If one graphs the set of points (x,y-k) with 0 \le x \le 106 and k \le y \le k + 17 such that they satisfy the inequality given above, the resulting graph looks like this:

Globally relevant infographics via the Olympic Rings.

Gustavo Sousa “uses the five colorful rings, representing each of the five continents taking part in the games every four years, to display a series of informative graphs about the world we live in today. The topics range from general facts like the world’s population to staggering statistics that reveal the ratio of people living with HIV, as symbolized by the size of the circle representing their continental location. Key: Blue is Oceania (Australia and its proximate islands); Yellow is Africa; Black is Europe; Green is Asia; Red is the Americas.”

By Gustavo Sousa, text via My Modern Met.

Stephen Merchant on Venn Diagrams. Very funny but also NSFW

Kurt Vonnegut and the graph of infinite happiness

Classic Vonnegut on “The Shape of Stories.” The graphs only make it cooler.

Via @cogdog

Function World looks awesome!

By Grant Snider, via Drawn.ca.

Why I majored in Biology: The Pie Chart.

Via sugarglue.tumblr.com

When Bar Graphs are Suspicious.

Via i.imgur.com.

Percent chance that each of these bars will reach the top of this graph. #funny via@BenGreenman

Via I Love Charts and Ben Greenman

%d bloggers like this: